
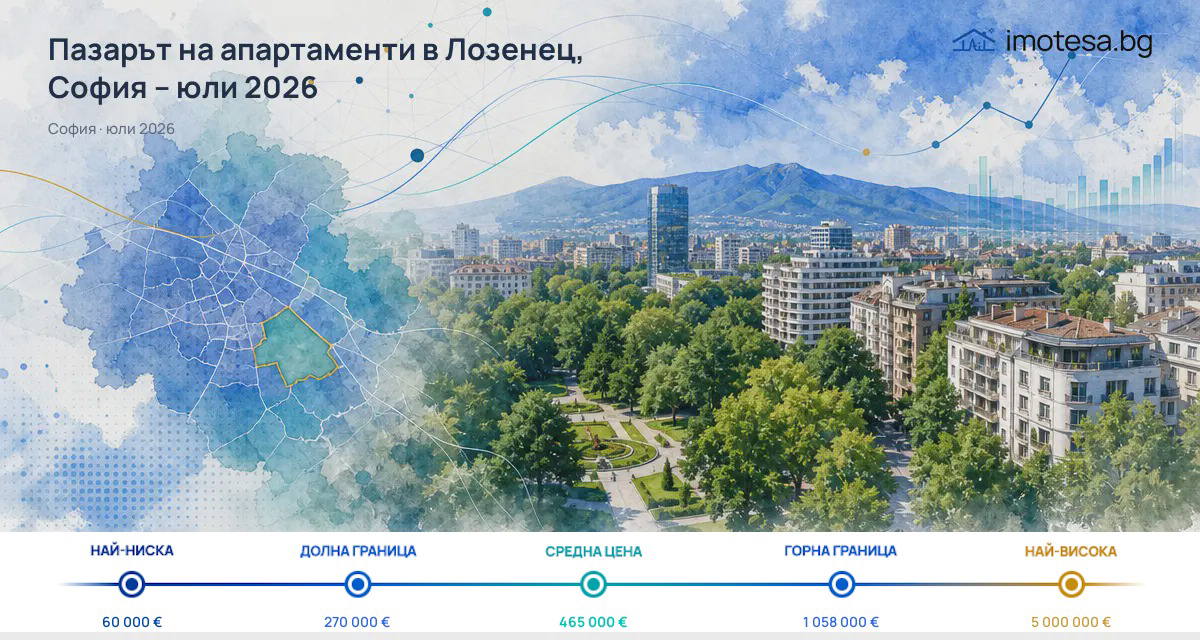
This text examines apartment asking prices in Lozenets in July 2026. The data refer to listings observed during the reporting month, not to transactions or current availability. The typical price is €3,983/sq m, and for a whole apartment the typical asking price is €465,000.
The typical price is the value at the midpoint of the ordered asking prices (the median). In Lozenets, 689 listings and 577 linked properties were observed for sales, which is separate information from the rental segment.
asking prices for sales
The main level for Lozenets in July is €3,983/sq m, and the typical asking price for a whole apartment is €465,000. This shows the price level in two units for the same observed listings.
The distribution around this level is from €2,894/sq m at P10 to €5,445/sq m at P90. These two values outline the central 80% of observed asking prices, not the lowest and highest in the set.
For comparison with Sofia, the typical price in Lozenets is higher by €1,403/sq m or +54.4%. This is a comparison with the city level for the same month and indicator, not an assessment of transactions.

how the level is changing
Over the short horizon, Lozenets is at -0.1% compared to June 2026, when the typical price was €3,987/sq m. Over the longer horizon, July versus April 2026, the movement is +1.7% at a level of €3,918/sq m. These are two separate periods and do not describe the same change.
Sofia is also at -0.1% compared to June and -0.2% compared to April. Thus, Lozenets and the city appear close in one-month movement, but different over the three-month horizon: the district is up, while the city is slightly down.
For the number of linked properties, Lozenets is at -0.2% compared to June and +33.6% compared to April. Sofia is at +1.4% compared to June and +38.0% compared to April. These are movements in the reported linked properties, not proof of identical coverage or composition between periods.
comparison with selected districts
In the selected group of districts, Lozenets is more expensive than Iztok and Meditsinska Akademiya, but cheaper than Doktorski Pametnik, Yavorov, Ivan Vazov, and Izgrev. The comparison is only with selected districts in Sofia and is not a complete city ranking.
- higher than Iztok: €3,983/sq m versus €3,875/sq m
- higher than Meditsinska Akademiya: €3,983/sq m versus €3,858/sq m
- lower than Doktorski Pametnik: €3,983/sq m versus €6,154/sq m
- lower than Yavorov: €3,983/sq m versus €4,382/sq m
- lower than Ivan Vazov: €3,983/sq m versus €4,200/sq m
- lower than Izgrev: €3,983/sq m versus €4,178/sq m
This means that exceeding Sofia’s level does not exclude lower values than some of the selected more expensive districts. The data provide only these pairwise comparisons, without supporting broader conclusions about ranking.
| Neighbourhood | Median price (€/sqm) | Difference |
|---|---|---|
| Doktorski Pametnik | 6,154 | +54,5% |
| Yavorov | 4,382 | +10% |
| Ivan Vazov | 4,200 | +5,4% |
| Izgrev | 4,178 | +4,9% |
| Lozenec | 3,983 | — |
| Iztok | 3,875 | -2,7% |
| Medicinska Akademiya | 3,858 | -3,1% |
| Average for Sofia | 2,580 | -35,2% |
rental asking prices
The typical rental price in Lozenets is €850/month. In June it was €820/month, so for July the change is +3.7%. Here too, these are asking rents, not agreed rental transactions.
The rental distribution is from €590/month at P10 to €2,000/month at P90. As with sales, these are the boundaries of the central 80% of observed offers, not the minimum and maximum.
In the rental segment, 928 listings and 677 linked properties were observed. The number of listings also includes records without a linked property, and the completeness of linking is unknown.
observed listings and properties
For sales, Lozenets has 689 listings and 577 linked properties. For Sofia, 30,550 listings and 23,698 properties were recorded. These counts describe the observed offers and linked properties, but do not allow calculation of listings per property, duplicate listings, new offers, or sales.
The comparison by properties is also only descriptive. Lozenets is at -0.2% compared to June and +33.6% compared to April, while Sofia is at +1.4% and +38.0% for the same horizons. Due to unknown completeness of linking and different listing visibility, these numbers do not imply equal coverage.
For rentals, Lozenets shows 928 listings and 677 linked properties. There are no data on demand, transactions, housing quality, or current availability, so no conclusions about activity can be drawn from the counts.
what the data show
July asking prices in Lozenets remain above Sofia’s level, but are below some of the selected more expensive districts and above others. The short-term horizon is almost unchanged, while the three-month horizon shows different directions for price and for the number of linked properties.
For the reader, the key point is that these are asking prices and observed listings, not transactions. This makes the data useful for describing published offers during the month, but not for conclusions about completed sales or current availability.