
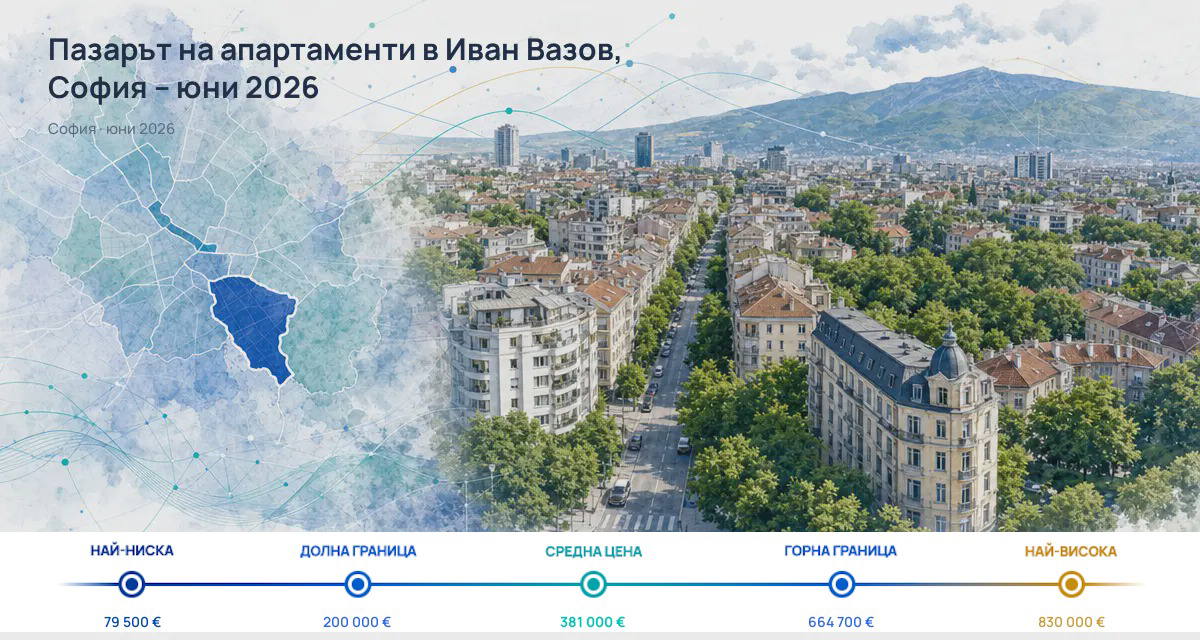
In June 2026, the typical asking price for apartments in Ivan Vazov is €4,153/sq m, with a total typical price of €381,000. Here, typical price means the value at the midpoint of the sorted asking prices (the median).
The text covers asking prices observed during the reporting month, not transactions. For rents, the typical asking price is €800/month.
Asking prices for sales
For apartment sales in Ivan Vazov, the reported typical price is €4,153/sq m. This is €1,570/sq m above Sofia’s level, which is €2,584/sq m, or 60.7% higher.
Alongside the price per square metre, the observed total typical price is €381,000. The two values describe the same monthly observation, but through different measures, so they should not be read as the same number.
For the distribution of sale listings, the central 80% of observed prices per square metre are between €3,305 and €5,457/sq m. These bounds are not the minimum and maximum, but outline the average range of observations for the month.

How it changed over the month
Compared to May 2026, the typical asking sale price in Ivan Vazov is down by -0.2%. This change is higher than the city’s, which is -0.3%, by 0.1 percentage points.
For the number of linked properties for sale, the movement is downward: 50 properties in June versus 51 in May, or -2.0%. In Sofia, linked properties increased from 21,503 to 23,364, which is +8.7%.
Here, the property comparison is only indicative. The number of linked properties depends on the completeness of linking, which is not known, so the figures should not be read as an exact measure of the same coverage.
Comparison with selected districts
The districts selected for comparison are reference points from Sofia, not a complete ranking. Geographical proximity is not established and should not be assumed.
In this selected group, Ivan Vazov is more expensive than Iztok, Lozenets, and Meditsinska Akademiya, but cheaper than Doktorski Pametnik and Izgrev, and more expensive than Yavorov.
- compared to Doktorski Pametnik: cheaper by €1,402/sq m
- compared to Izgrev: cheaper by €130/sq m
- compared to Yavorov: more expensive by €18/sq m
- compared to Iztok: more expensive by €153/sq m
- compared to Lozenets: more expensive by €166/sq m
- compared to Meditsinska Akademiya: more expensive by €307/sq m
These comparisons show only the direction and size of the difference compared to the selected districts. They do not allow for a complete ranking within Sofia.
| Neighbourhood | Median price (€/sqm) | Difference |
|---|---|---|
| Doktorski Pametnik | 5,556 | +33,8% |
| Izgrev | 4,283 | +3,1% |
| Ivan Vazov | 4,153 | — |
| Yavorov | 4,136 | -0,4% |
| Iztok | 4,000 | -3,7% |
| Lozenec | 3,987 | -4% |
| Medicinska Akademiya | 3,846 | -7,4% |
| Average for Sofia | 2,584 | -37,8% |
Rental listings
For apartment rentals in Ivan Vazov, the typical asking price is €800/month. This is €15 above May, when the level was €785/month, or +1.9%.
For the rental market, the central 80% of observed listings are between €536 and €1,800/month. Here too, the upper and lower bounds describe the central range, not the lowest or highest observed values.
In June, 184 rental listings and 138 linked properties were observed. As with sales, listings include records without a linked property, and the completeness of linking is not known.
Volume of observed listings
For sales in Ivan Vazov, 64 listings and 50 linked properties were observed. These are two different measures: listings include unlinked records, while properties count only distinct linked units.
For Sofia, the sales observations are 30,323 listings and 23,364 properties. Month-on-month, both the district and the city show movement in the number of linked properties, but these figures do not prove identical scope or composition of the observation.
Therefore, the count itself should not be read as a measure of demand, transactions, or current availability. The data describe what asking records were observed in June 2026.
Conclusion
The June data for Ivan Vazov show sale listings above Sofia’s level, but with a slight monthly decline, and rents with a slight increase compared to May. Comparisons with selected districts show both higher and lower values than various benchmarks, without this being a complete ranking.
Since these are asking prices observed in a single month, the data provide a snapshot, not a forecast.