
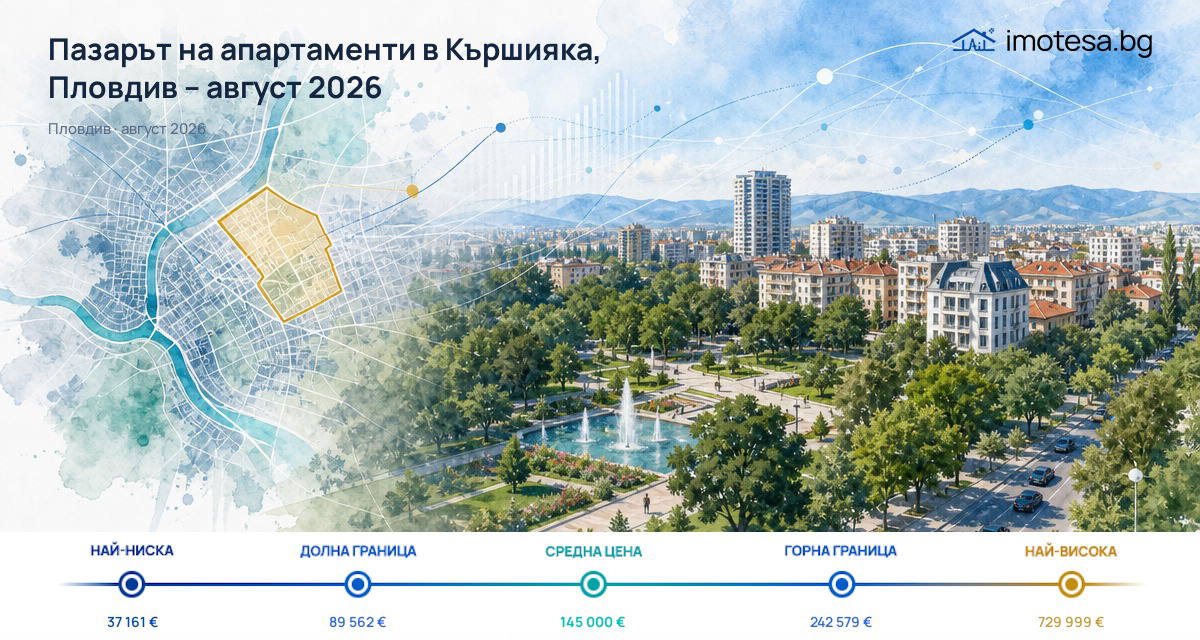
In August 2026, the asking prices for apartments for sale in Karshiyaka show a typical price of €1,586/sq m. The value at the midpoint of the sorted asking prices (the median) is €145,000 as a total amount.
Around this value, the observed listings are spread across a wide but measurable range: P10 is €1,134/sq m and P90 is €2,371/sq m. This is the central 80% of observed prices, not the minimum and maximum.
Apartment asking prices
The data are for asking prices recorded during the month, not for completed transactions. For Karshiyaka, this means 2,381 observed listings and 2,148 different linked properties for sales. The two numbers should not be mixed: listings include unlinked records, while the property count covers only the different linked properties.
Besides the typical price of €1,586/sq m, the overall typical value is €145,000. For the reader, this is useful because it shows not only the price per square metre but also a reference for the entire listing. At the same time, P10 of €1,134/sq m and P90 of €2,371/sq m outline the central part of the observed listings, without saying anything about the extreme minimum or maximum values.

Change in the typical price
Month-on-month, the picture is almost unchanged: Karshiyaka is at +0.1% compared to July 2026, or €1,586/sq m versus €1,585/sq m a month earlier. For Plovdiv, the change over the same period is -0.2%. Thus, the district diverges from the city’s level by +0.3 percentage points in terms of pace.
Comparing August to May 2026, Karshiyaka is at -0.5%, while Plovdiv is at 0%. Here too, the directions do not fully coincide: the district remains below the May value, while the city’s level is practically unchanged over the same longer period. These are two separate periods—August versus July and August versus May—and they should not be mixed.
Comparison with selected districts
The comparison is only with selected districts of Plovdiv, arranged by higher typical asking price. This is not a complete city ranking and does not imply geographical proximity. In this selection, Karshiyaka is more expensive than Kamenitsa 2, but cheaper than Mladezhki Halm, Sadiyski, Kamenitsa 1, Center, and Marasha.
Compared to the city’s level, Karshiyaka is also higher: €1,586/sq m versus €1,505/sq m. However, it remains below several of the selected more expensive districts. This is an important check, because being above Plovdiv does not automatically mean being above most of the selected neighbouring or non-neighbouring areas in the selection.
| Neighbourhood | Median price (€/sqm) | Difference |
|---|---|---|
| Marasha | 2,313 | +45,8% |
| Centyr | 2,289 | +44,3% |
| Kamenica 1 | 2,153 | +35,8% |
| Sydiiski | 1,869 | +17,8% |
| Mladejki Hylm | 1,761 | +11% |
| Kyrshiyaka | 1,586 | — |
| Kamenica 2 | 1,561 | -1,6% |
| Average for Plovdiv | 1,505 | -5,1% |
Rental listings
For rentals, the typical price in Karshiyaka is €500/month. Here too, the data are for asking prices observed in August 2026, not for signed contracts. P10 is €370/month and P90 is €750/month, outlining the central 80% of observed rental listings.
The rent has not changed compared to either July or May: in both cases, the movement is 0%. This is a separate indicator from the typical sale price and should not be read as a change in the same property or as a signal for future movement.
Observed listings and properties
In August, 2,381 listings and 2,148 linked properties for sale were observed in Karshiyaka. For Plovdiv, the numbers are 16,660 listings and 15,022 linked properties. There are two limitations here that are important for interpretation: listings include unlinked records, and the completeness of linking to properties is unknown.
Compared to July, Karshiyaka has +37 properties, or +1.8%, while Plovdiv has -93 properties, or -0.6%. Three months back, Karshiyaka is at +107 properties, or +5.2%, and Plovdiv is at +303 properties, or +2.1%. The differences in pace are visible, but they do not automatically mean a broader or narrower supply, because comparability by property count is only a heuristic.
In percentage points, the district is above the city by +2.4 points on a monthly horizon and by +3.2 points on the three-month horizon. This describes a difference in movement, not proof of identical composition or coverage of the observed properties.
Conclusion
August 2026 leaves Karshiyaka with a typical asking price above the city’s level, but below several of the more expensive selected districts in Plovdiv. The sale price moves slightly and in different directions on a monthly and three-month horizon, while the rent remains at €500/month without change. Thus, the data outline rather moderate movement, rather than a sharp change in listings.