
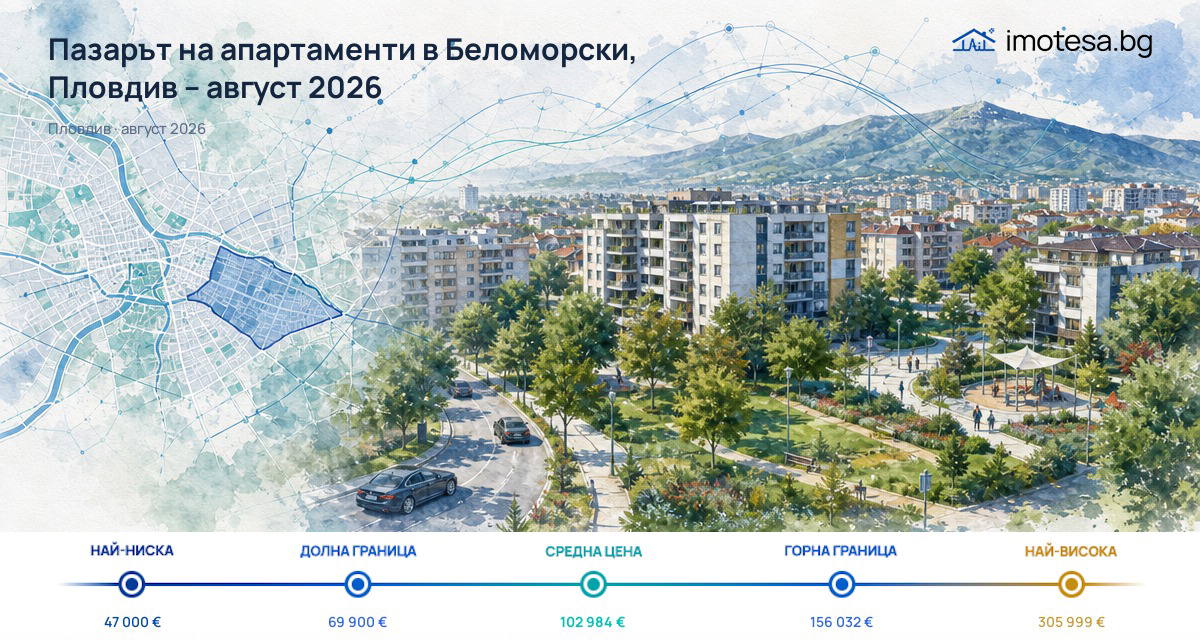
In August 2026, the typical asking price for apartments in Belomorski is €1,187/sq m and €102,984 per property. These are asking prices observed during the month, not transaction prices. Here, the typical price is the value at the midpoint of the ordered asking prices (the median).
The sample includes 625 listings and 604 properties. The difference between the two figures is expected, as listings may include records without a linked property, and the completeness of the linking is not known.
Asking prices in Belomorski
The main indicator for August is €1,187/sq m. For a single property, the typical asking value is €102,984. This shows the picture for the district both per square metre and per listing.
The distribution of observed prices is broader than a single indicator. €951/sq m and €1,458/sq m mark the central 80% of visible values, not the minimum and maximum. This helps to see where most of the listings are concentrated during the month.
The combination of 625 listings and 604 properties shows that the observed supply is measured by listings, not by unique transactions or by current availability as of today.

Changes in May and July
Belomorski is at +0.2% in August compared to July and +1.3% in August compared to May. For the same two periods, Plovdiv is at -0.2% and 0% respectively. The data describe different months, not the same housing unit.
For supply, Belomorski is at -0.7% in the number of linked properties compared to July and +1.5% compared to May. In Plovdiv, the changes are -0.6% and +2.1%. These are movements in the observed listings and linked properties, without any conclusion about sales.
In this data set, Belomorski does not show a sharp monthly jump or drop; rather, there is a slight upward movement in price, along with fluctuations in the number of linked properties across the different periods.
Comparison with selected districts in Plovdiv
The following comparisons are only with selected districts of the city. Geographical proximity is not established and this is not a complete ranking of Plovdiv.
- Belomorski is cheaper than Marasha — €1,187/sq m vs €2,312/sq m.
- Belomorski is cheaper than Center — €1,187/sq m vs €2,289/sq m.
- Belomorski is cheaper than Kamenitsa 1 — €1,187/sq m vs €2,153/sq m.
- Belomorski is cheaper than Sadiyski — €1,187/sq m vs €1,869/sq m.
- Belomorski is cheaper than Mladezhki Halm — €1,187/sq m vs €1,761/sq m.
- Belomorski is cheaper than Karshiyaka — €1,187/sq m vs €1,586/sq m.
Compared to Plovdiv’s level, Belomorski is cheaper by €318/sq m or 21.1%. Thus, the district remains below the city level, while in the same set of comparisons all selected districts have higher typical asking prices.
| Neighbourhood | Median price (€/sqm) | Difference |
|---|---|---|
| Marasha | 2,313 | +94,8% |
| Centyr | 2,289 | +92,9% |
| Kamenica 1 | 2,153 | +81,4% |
| Sydiiski | 1,869 | +57,4% |
| Mladejki Hylm | 1,761 | +48,4% |
| Kyrshiyaka | 1,586 | +33,6% |
| Belomorski | 1,187 | — |
| Average for Plovdiv | 1,505 | +26,8% |
Supply during the month
In August 2026, there were 625 listings and 604 properties observed in Belomorski. The indicator for the number of listings also includes records without a linked property, while the property count reflects only the different linked properties.
Compared to July, linked properties are -0.7%, and compared to May — +1.5%. For Plovdiv, the same periods are -0.6% and +2.1%. This describes the observed volume of listings, not new transactions or marketing activity.
Month-on-month, Belomorski has 4 fewer linked properties than in July, and 9 more than in May. The city as a whole has 93 fewer linked properties compared to July and 303 more compared to May.
Conclusion
In August 2026, Belomorski combines a typical asking price below Plovdiv’s level with a slight upward movement compared to July and May. In the selected districts of the city, the comparisons are consistently below the higher values in the list, but the data remain for listings, not transactions, and are not sufficient for a forecast.
This is a useful snapshot of the observed apartment listings, not an assessment of future market moves.