
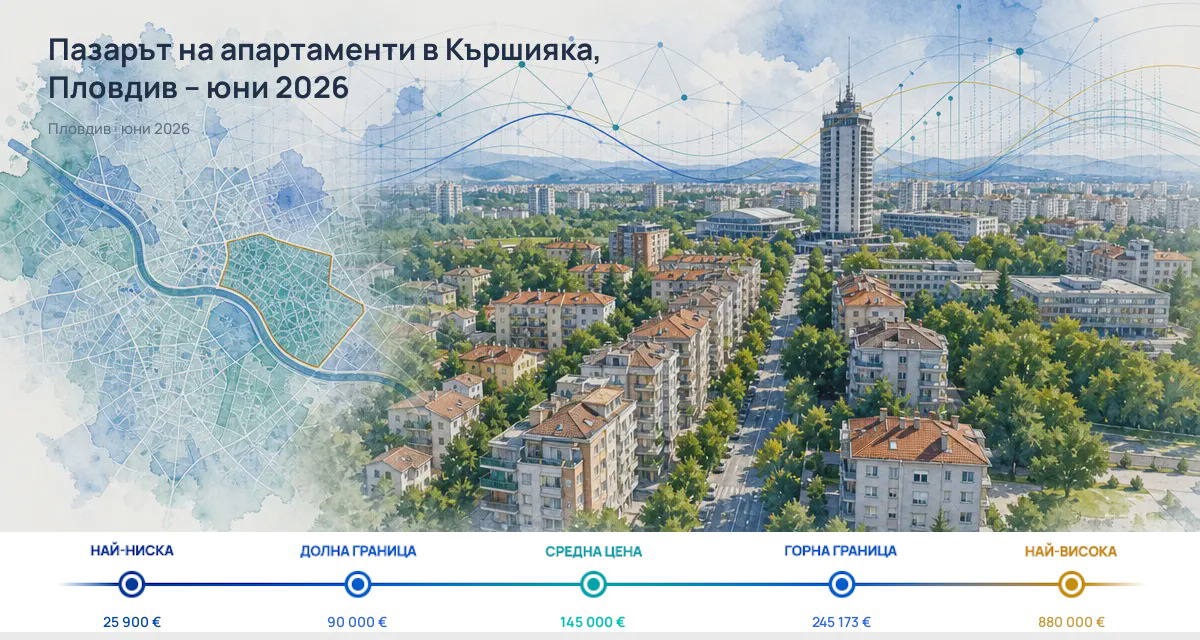
In June 2026, the typical asking price for apartments in Karshiyaka is €1,600/sq m, while for the entire apartment market in Plovdiv the level is €1,511/sq m. These are asking prices observed during the reporting month; the typical price is the value at the midpoint of the sorted asking prices (the median).
In monetary terms, the typical asking price for a home in the district is €145,000. In the distribution of observed values, P10 is €1,145/sq m and P90 is €2,409/sq m, so the central 80% of listings remain within a relatively wide range. This description is not about deals and does not indicate availability as of today.
Supply and Typical Price
Karshiyaka combines a typical price of €1,600/sq m and a typical total price of €145,000 for apartment listings in June. These two measures look at different things: the first is price per square metre, while the second is the total price of the listed home. Therefore, they should not be read as the same value in different forms.
P10 of €1,145/sq m and P90 of €2,409/sq m show where the majority of the observed supply is concentrated. This is useful as a guide to the distribution of listings within the month, but does not allow conclusions about deals, housing quality, or current availability.

Changes Compared to May and March
Compared to May, the typical price in Karshiyaka is higher by +0.3%: €1,600/sq m in June versus €1,594/sq m in May. Compared to March, the change is +0.2%: €1,600/sq m in June versus €1,597/sq m in March. In both timeframes, the movement is small and does not clearly exceed the bounds of normal monthly fluctuations.
For Plovdiv, the typical price is also up: +0.3% compared to May and +1.0% compared to March. Thus, the monthly movement in the district is practically the same as the city’s, while over the three-month horizon Karshiyaka grows more slowly than the city: +0.2% versus +1.0%.
For rents, the typical value is €500/month and does not change compared to May. This is a separate market segment and cannot be mixed with the asking prices for sales.
Comparison with Selected Districts
The comparisons here are with selected districts of Plovdiv, not a full city ranking. They show that being above the city level can coexist with lagging behind other districts in the set. For Karshiyaka, this is clearly seen in the following pairs:
- more expensive than Otdih i Kultura: €1,600/sq m versus €1,596/sq m
- cheaper than Mladezhki Halm: €1,600/sq m versus €1,635/sq m
- cheaper than Sadiyski: €1,600/sq m versus €1,800/sq m
- cheaper than Kamenitsa 1: €1,600/sq m versus €2,121/sq m
- cheaper than Tsentar: €1,600/sq m versus €2,283/sq m
- cheaper than Marasha: €1,600/sq m versus €2,312/sq m
The same is seen in the city comparison: Karshiyaka is above Plovdiv’s level at €1,600/sq m versus €1,511/sq m, but this does not change the fact that compared to some of the selected more expensive districts, the value remains lower. Therefore, a comparison with the city and a comparison with an individual district can lead to different but simultaneously valid conclusions.
| Neighbourhood | Median price (€/sqm) | Difference |
|---|---|---|
| Marasha | 2,313 | +44,5% |
| Centyr | 2,283 | +42,7% |
| Kamenica 1 | 2,121 | +32,6% |
| Sydiiski | 1,800 | +12,5% |
| Mladejki Hylm | 1,635 | +2,2% |
| Kyrshiyaka | 1,600 | — |
| Otdih I Kultura | 1,596 | -0,3% |
| Average for Plovdiv | 1,511 | -5,6% |
Rental Listings
The rental segment in Karshiyaka shows a typical price of €500/month. The range for the central 80% of observed rental listings is between €370 and €730/month. This means that most of the listings in June fall within this band, but it should not be interpreted as a minimum or maximum.
The observation includes 668 rental listings and 572 linked properties. As is important with this type of data, listings may include records without a linked property, and the completeness of linking is not known. Therefore, these numbers should not be turned into conclusions about property listings, new rentals, or current availability.
The monthly change in rent is 0% compared to May, so within the available data there is no upward or downward movement between the two months.
Listings and Linked Properties
For sales in June in Karshiyaka, 2,392 listings and 2,177 linked properties were observed. In May, linked properties were 2,041, and in March 1,573. For Plovdiv, the corresponding levels are 17,042 listings and 15,367 linked properties in June, 14,719 properties in May, and 11,168 properties in March.
The change in the number of linked properties in Karshiyaka is +6.7% compared to May and +38.4% compared to March. For Plovdiv, the increases are +4.4% and +37.6%. This is a comparison of observed listings and linked properties in separate months; it is not a transactional snapshot and does not allow conclusions about completed deals.
Another important point: the number of listings also includes records without a linked property, so it is not possible to calculate listings per property or to read it as a direct measure of market activity. The data describe what was observed in June, not what remained available afterwards.
Conclusion
In June 2026, Karshiyaka is above the city level in terms of typical asking price for sales, but does not stand above most of the selected districts in the comparison. At the same time, rents remain unchanged compared to May, and the observed base of linked properties increases both on a monthly and a quarterly basis. Thus, the picture is of moderate price movement and a broader observed supply, without the data allowing for a forecast or conclusions about deals.