
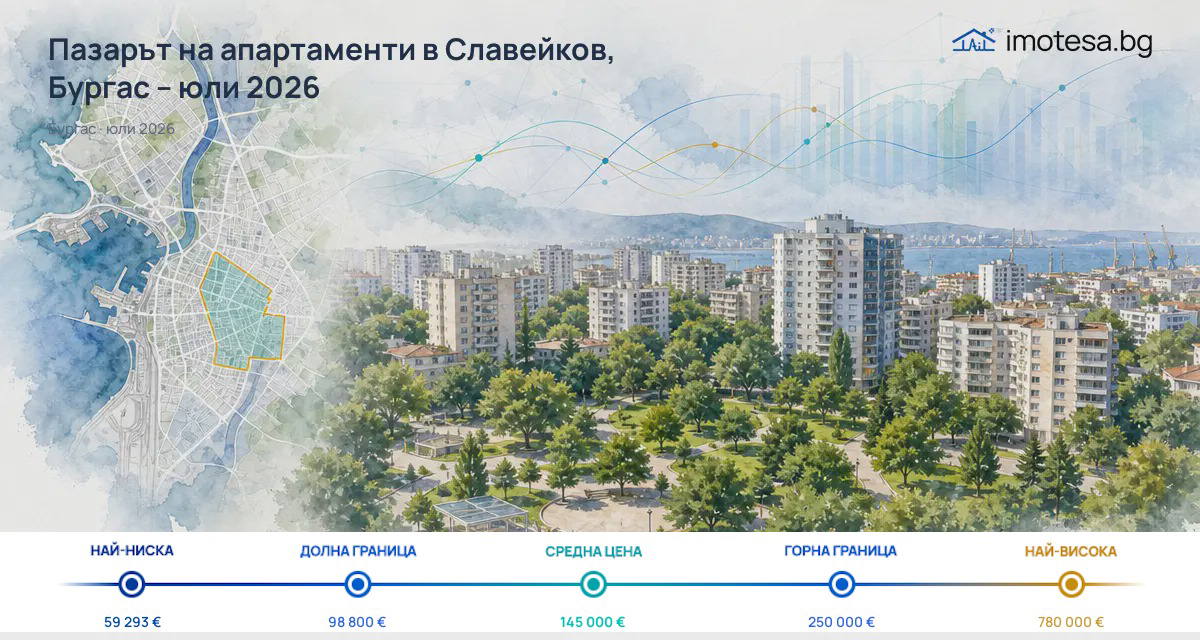
The text tracks asking prices for apartments in Slaveykov in July 2026, not transactions. The typical price is €2,045/sq m — the value at the midpoint of the sorted asking prices (the median).
For the whole apartment, the typical asking price is €145,000. The data refer to listings observed during the reporting month and do not describe current availability as of today.
asking prices
In July 2026, the typical asking price in Slaveykov is €2,045/sq m, and the typical asking price for the whole apartment is €145,000. These are values from observed listings, not concluded transactions.
P10 is €1,494/sq m, and P90 is €2,574/sq m. These two values outline the central 80% of the observed asking prices per square metre, but are not the minimum and maximum.
When looking only at sales listings, the picture is of a market of offers, not of completed transactions. From this base, no conclusions can be drawn about sold properties, current availability, or changes to the same property.

monthly changes
Compared to June, the typical price per square metre in Slaveykov is lower by 1.8%: from €2,084/sq m to €2,045/sq m. At the same time, Burgas as a whole is up by 0.6% between June and July, and for July compared to April, the city level is up by 1.5%.
This means that the monthly change in Slaveykov is 2.5 percentage points lower than that for Burgas. The comparison is point-to-point between the same months, not between a district and the city in different periods.
The volume of linked properties is also moving up. In Slaveykov in July, 370 properties were recorded versus 337 properties in June, that is, +9.8%. For Burgas, the growth for the same months is +2.8%, and for July compared to April, the city increase is +30.7%.
comparison with selected districts
The comparison here is with selected districts of Burgas, ranked by highest typical asking price. This is not a complete ranking and geographic proximity is not established. In this selection, Slaveykov is more expensive than Burgas by +€219/sq m, or +12.0%.
At the same time, Slaveykov is cheaper than Lazur by -€673/sq m, cheaper than Center by -€367/sq m, and cheaper than Zornitsa by -€168/sq m.
In the same selection, Slaveykov is more expensive than Vazrazhdane by +€17/sq m, more expensive than Bratya Miladinovi by +€98/sq m, and more expensive than Izgrev by +€151/sq m. This shows that a higher level than Burgas can coexist with lower values compared to some of the selected districts.
| Neighbourhood | Median price (€/sqm) | Difference |
|---|---|---|
| Lazur | 2,718 | +32,9% |
| Centyr | 2,412 | +17,9% |
| Zornica | 2,213 | +8,2% |
| Slaveikov | 2,045 | — |
| Vyzrajdane | 2,028 | -0,8% |
| Bratya Miladinovi | 1,947 | -4,8% |
| Izgrev | 1,895 | -7,3% |
| Average for Burgas | 1,826 | -10,7% |
rents
For rents in Slaveykov in July 2026, the typical monthly asking amount is €550/month. This is the total monthly price of the listing, not a price per square metre. P10 is €350/month, and P90 is €1,000/month, so the central 80% of observed rental listings fall between these two values.
Compared to June, the typical rent is higher by 10.0%: from €500/month to €550/month. The data show movement in rental listings, but do not allow conclusions about transactions, yield, or recommendations for action.
volume of supply
In July, 431 listings for sale and 370 different linked properties were observed. The number of listings also includes listings without a linked property, while the number of properties counts only the different linked properties; the completeness of the linking is unknown.
For rentals, 133 listings and 121 linked properties were observed. These two counts are separate measures and should not be converted into number of transactions, number of new listings, or an assessment of market activity.
For sales, the linked properties in Slaveykov are +33 properties compared to June, while in Burgas the increase is +89 properties. This is another signal of more observed linked properties during the month, but not proof of current availability or demand.
conclusion
July 2026 leaves Slaveykov with a typical asking price above Burgas’s level, but with a monthly decline in sales listings and growth in rents. At the same time, the price range and volume of observed listings show only what the offers looked like during the month, not what transactions took place or what will happen in the future.
For the reader, the most important thing is that asking prices are tracked here, not completed transactions. Therefore, the data are useful for comparing observed offers, but do not provide a basis for a forecast.
imotesa is an independent tool for reviewing these data.