
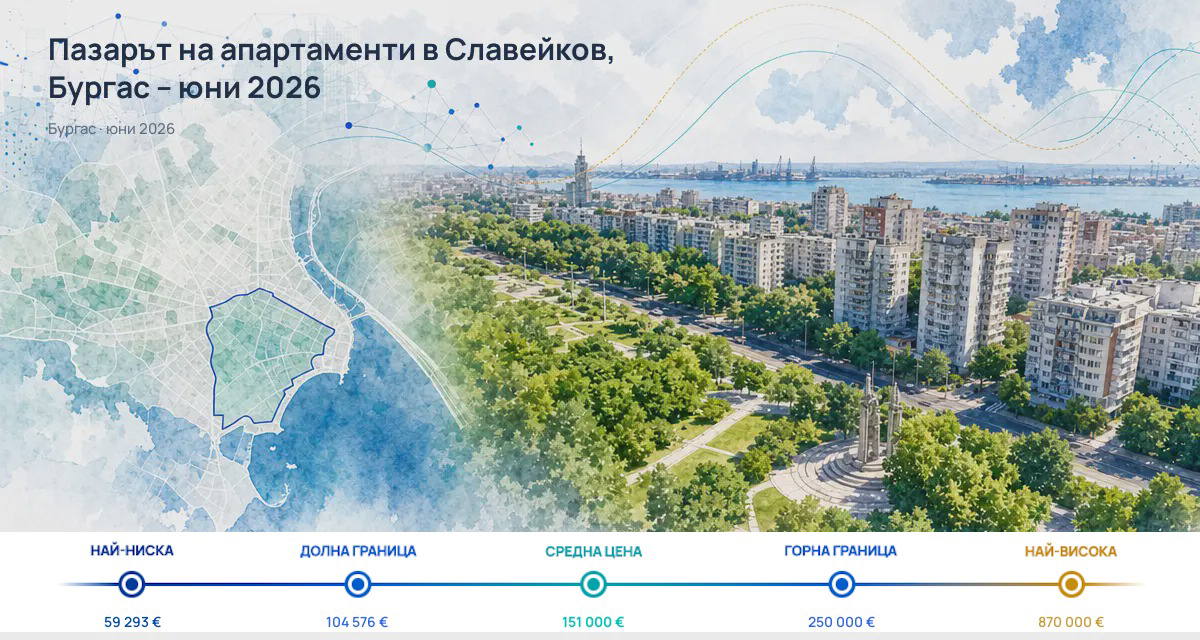
In June 2026, the typical price for apartments in Slaveykov is €2,084/sq m based on asking prices observed in listings; this is the value at the midpoint of the sorted asking prices (the median).
In absolute terms, the typical total asking price is €151,000. The central 80% of observed prices fall between €1,599 and €2,606/sq m, which shows the distribution of listings, not the minimum and maximum.
Offer Levels in June
The data for Slaveykov refer to apartment listings observed during the reporting month, not to transactions or to current availability as of today. This is important because the reported values reflect asking prices in listings, not the prices of actual completed deals.
For June 2026, a €2,084/sq m typical price and a €151,000 typical total listing amount were recorded. The gap between P10 and P90 is wide: €1,599/sq m at the lower bound of the central 80% and €2,606/sq m at the upper bound of the central 80%.
This range suggests that listings in the district appear at various price levels, but the figures themselves do not allow conclusions about housing quality, floor area, furnishings, or other characteristics not measured in the dataset.

Change Compared to May
The month-on-month change in sale prices in Slaveykov is +1.9% compared to May 2026, when the typical price was €2,045/sq m. This reflects changes in observed asking prices between two separate months, not an increase in the price of the same property.
For Burgas as a city, the change is +0.6% for the same month, from €1,803/sq m in May to €1,815/sq m in June. Thus, Slaveykov is rising faster than the Burgas level by +1.3 percentage points.
There is also a change in the number of linked properties for sale: from 297 in May to 337 in June, or +13.5%. For Burgas, the data show 2,939 properties in May and 3,205 in June, which is +9.1%. The difference between the two changes is +4.4 percentage points.
Comparison with Selected Districts
The comparison here is with selected districts in the city, ranked by highest typical asking price. This is not a complete ranking, but a limited set for comparison. Thus, it is possible for Slaveykov to be above the Burgas level and at the same time below several of the selected more expensive districts.
- Slaveykov is more expensive than the Burgas level by +€269/sq m or +14.8%.
- Slaveykov is cheaper than Lazur by -€579/sq m or -21.7%.
- Slaveykov is cheaper than Center by -€312/sq m or -13.0%.
- Slaveykov is cheaper than Zornitsa by -€125/sq m or -5.7%.
- Slaveykov is cheaper than Vazrazhdane by -€9/sq m or -0.4%.
- Slaveykov is more expensive than Bratya Miladinovi by +€147/sq m or +7.6%.
- Slaveykov is more expensive than Izgrev by +€169/sq m or +8.9%.
These comparisons show that the district stands above the city level, but below some of the selected districts and above others. The data themselves do not allow for broader conclusions about the entire city ranking, as the available set is limited by selection.
| Neighbourhood | Median price (€/sqm) | Difference |
|---|---|---|
| Lazur | 2,663 | +27,8% |
| Centyr | 2,396 | +15% |
| Zornica | 2,209 | +6% |
| Vyzrajdane | 2,093 | +0,4% |
| Slaveikov | 2,084 | — |
| Bratya Miladinovi | 1,937 | -7,1% |
| Izgrev | 1,914 | -8,1% |
| Average for Burgas | 1,815 | -12,9% |
Rental Listings
For rentals, these are also asking prices, not agreed rents. In June 2026, the typical monthly amount in Slaveykov is €500/month.
The central 80% of rental listings are between €350/month and €950/month. This distribution describes the observed listings, not rental levels from signed contracts.
Compared to May 2026, the typical rental amount is unchanged, as the recorded value was also €500/month then. The data do not allow for conclusions about causes or future movement.
Observed Supply
In Slaveykov for June 2026, 400 sale listings and 337 linked properties were observed. The number of listings includes those without a linked property, while the property count covers only distinct linked properties; the completeness of linking is unknown.
For rentals, 134 listings and 128 linked properties were observed. Here too, the number of listings and the number of properties are two different counts and should not be interpreted as the same thing.
For sales, linked properties in Slaveykov are up from May by +13.5%, while for Burgas the increase is +9.1%. This is a comparison of two movements on the same dates, without drawing conclusions about more or fewer homes in an absolute sense beyond the measured values.
Conclusion
The June data for Slaveykov show a typical asking price of €2,084/sq m and a typical total amount of €151,000, with an increase from May and a level above the city. At the same time, the district remains below some of the selected more expensive districts in Burgas, so the comparison is mixed, not one-directional.
There are clear limitations: we observe listings, not transactions; the counts for listings and properties are not interchangeable; and the set of districts is selected, not a complete city ranking. Therefore, the most reliable reading is for the measured levels and their comparisons, without drawing further conclusions.