
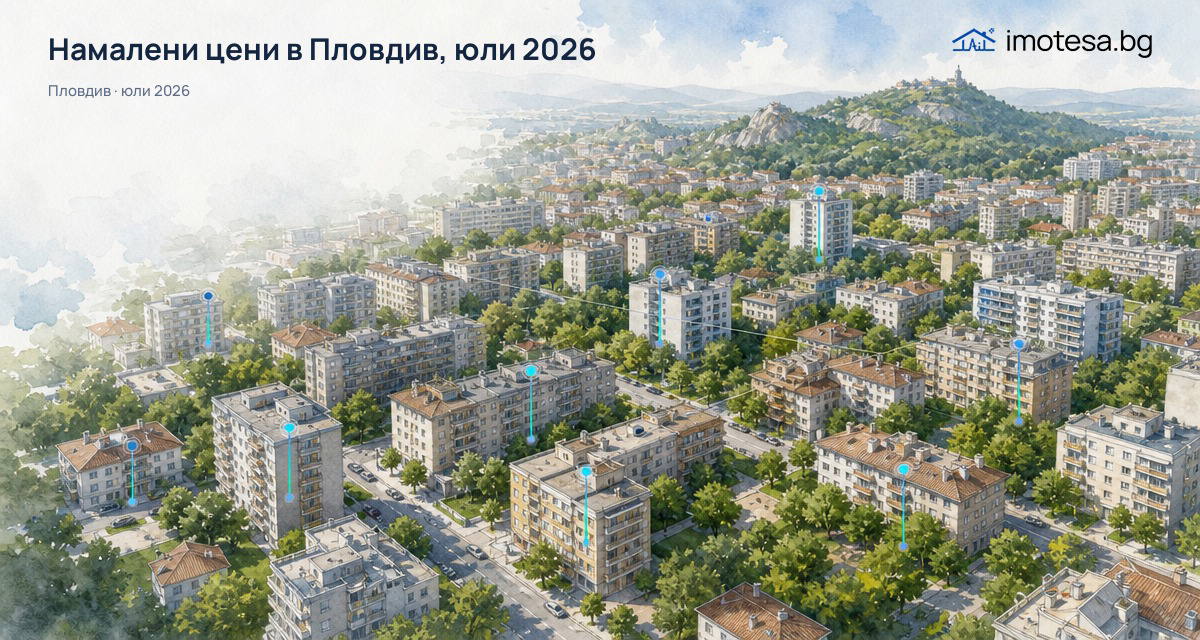
In July 2026, 293 apartment sellers in Plovdiv reduced their asking price. This means that 55.1% of all changes to asking prices during the month were reductions rather than increases. At the same time, 250 listings raised their price, showing that both directions of adjustment remain part of the market.
These data reflect seller behavior during that specific month and allow tracking what happens to asking prices for apartments in the city.
How many listings reduced their price in July
A total of 293 active apartment listings in Plovdiv had a reduced asking price in July 2026. This represents 1.9% of all active listings for the month. It is important to note that each reduced asking price is counted as a separate event, and some listings have lowered their price more than once. The total number of reductions is 307, meaning some sellers adjusted their price multiple times. The share of sellers who have reduced their price at least twice over the past year is 25.3%.
During the same period, 250 listings increased their asking price, indicating that not all changes were downward.
How large is the typical reduction
The typical reduction — the value below which half of all reductions fall and above which lies the other half (the median) — in July was -4.3% or -6,000 €. This means that for half of all reductions, the adjustment was smaller than this value, while for the other half it was larger.
The distribution of reductions shows that 29.6% were between 1% and 3%, 26.1% between 3% and 5%, 30% between 5% and 10%, and for 14.3% of cases, the reduction exceeded 10% compared to the previous price. This highlights that while larger reductions are not common, they are not exceptional either.
The time until first reduction among listings that lowered their price is 33 days. This shows that sellers who decide to adjust their asking price usually do so about a month after initial publication.
Which districts had most frequent reductions
District data cover the last three months to ensure a sufficiently large sample for accurate comparison. The highest share of listings with reduced prices was observed in Sudijski (9.2%), Mladezhki Halm (7.5%), Yuzhen (6.9%), Center (6.6%) and Kyuchuk Parizh (7.3%). In these areas, sellers most often resorted to reducing their asking price. In Center and Mladezhki Halm, typical reductions are among the largest — respectively -5.2% and -5.8%. In Hristo Smirnenski and Karshiaka, the share of reductions is lower but the number of listings with adjustments remains significant.
Neighbourhoods in Plovdiv with reduced prices — over the last 3 months
How has it changed over the past year
The share of reductions among all changes to asking prices in July 2026 is 55.1%. For comparison, this share was 61.2% in June and 64.4% in May. The highest share over the last five months was recorded in May, while March saw the lowest at 47.6%. In July there was a decrease by -6.1 percentage points compared to the previous month. Nationally, this share for Bulgaria was 68.3% for July, placing Plovdiv below Bulgaria’s average for that month. These movements reflect dynamics in seller behavior as they respond to market conditions with more or fewer frequent reductions to asking prices.
How we measure this
All data in this analysis relate to reductions in published asking prices on active listings rather than final transaction prices at which deals close. The first published price on each listing is not counted as a reduction; changes under 1% are ignored as statistical noise. The twelve-month series shows shares of reductions among all changes to asking prices allowing fair comparison between months regardless of how many listings were checked. District data cover three months to ensure sufficient representativeness.